2025-04-20 Weekly Notes
20 April 2025
I dedicated a good chunk of last week to prepare for my technical interview for the ESL, for which I read Josh Starmer’s Statquest books and Anil Ananthaswamy’s Why Machines Learn. Would highly recommend the three of them for a brush-up on the fundamentals and a bit of history of ML math.
I also had a meeting with Polly Hudson and Hendrik Herold where we discussed how we can integrate my tree data into the Colouring Cities platform. Also, we talked about the possibility of extracting deprivation and trees from the Charles Booth’s Maps from the 19th century in London, with the goal of comparing the trends in the era with current socio-economic metrics.
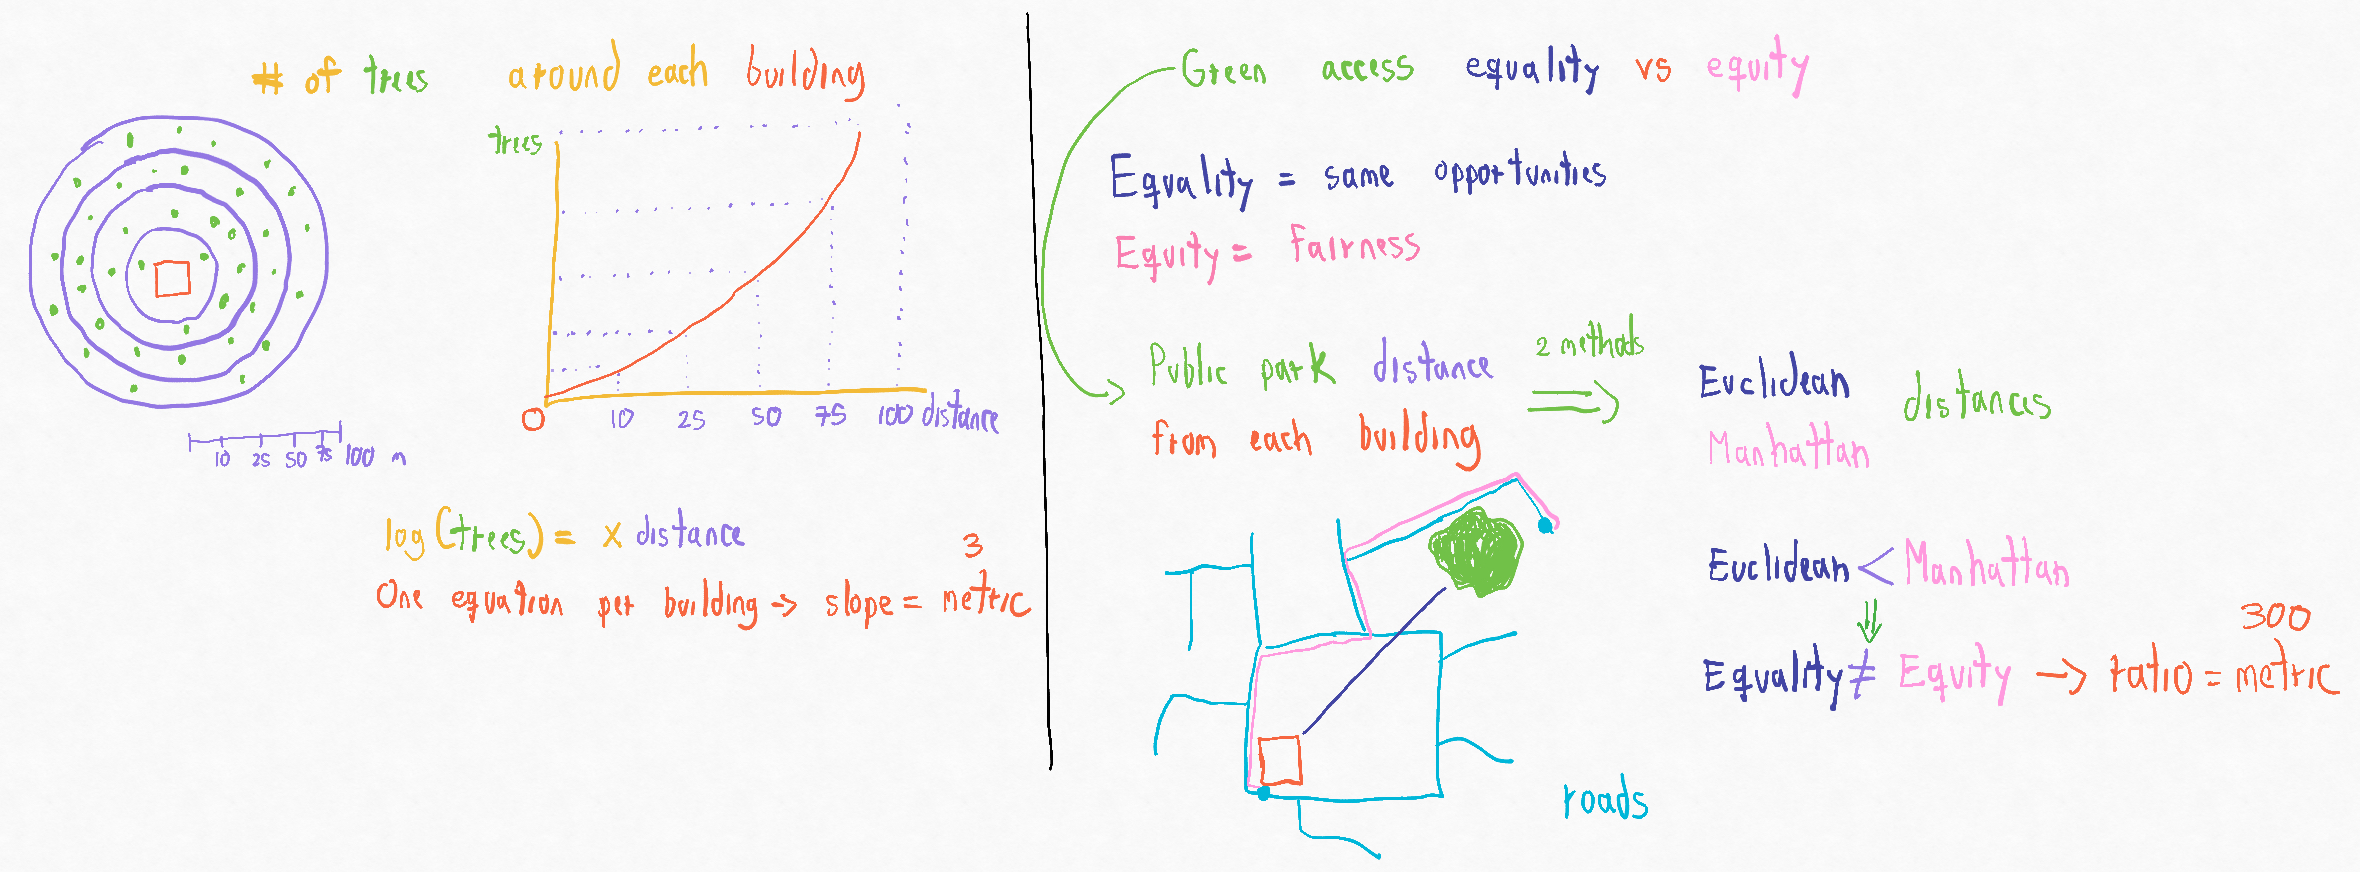
Finally, in my analysis of green equality I decided to measure the Gini Coefficient only in residential units in England, which account for 85% of all buildings (~25M). Bu I needed to define the metric that was going to be used as a measure of green wealth. Given that Gini is essentially an aggregate, I used the standard geographical units explained in a previous post but instead of taking the raw values, I made use of basic math. So for the 3-part of the 3-30-300 rule I had counted the number of trees at different buffer sizes around each building. With that information I calculated the slope of an exponential regression for each building, and that’s my final metric for this part, meaning that greater slopes mean a building is close to several trees, while lower slopes mean that the number of trees does not increase as you go further from the building (see left panel in the image).
For the 300-part I had modified the code to calculated Euclidean distance on top of the already working Manhattan distance from a building to its closest public park. While reading about the differences between equality and equity, I could see that both these metrics could be associated with each concept respectively. I’m not fully sure how to combine these two into one metric that I can input in the Gini calculation, because Gini measures wealth so greater numbers are better, but in this case, greater numbers are worse because they mean that the building is further away from a park. I’ve thought about using a ratio of equality and equity (see righ panel in the image) but I need to think this further, as measures of green inequality are not standardised.
PS: As I’ve mentioned in the past, I normally use R for plotting, which meant that I was normally working with local copies of my datasets in RStudio, mostly because the native installation of R in the Kinabalu HPC has some issues with GDAL, making the sf package impossible to use (geopandas in R, essentially). There is a workaround though, use conda as an R environment manager and install the libraries via the conda-forge channel, as explained here. However, RStudio cannot SSH into any remote machine, meaning that interactive sessions are not possible. Sadly, the new Positron IDE cannot recognise a conda environment as an R interpreter and defaults to Python. But VS Code can, and through the R extension it is possible to set the interpreter to the location of the conda (R) environment and make use of other VS Code stuff like Copilot. So, I guess it’s a bitter bye to RStudio for the foreseeable future.
PS2: Some familiar faces appear in the latest video about supercomputers released by the University of Cambridge social media team. 🤣