2025-03-09 Weekly Notes
09 March 2025
Hello! This week I worked on the optimisation of counting trees within a given geometry. This is a problem I had solved back in December, although not in the optimal way. Ihad segmented almost 400M trees from the Defra dataset, but now I had to count how many are within a 100 m radius of each one of the 29M buildings in England. I had solved this by iterating through the LSOAs (statistical geography) in England, but that process took about 11 days to complete with the SQl API of Apache Sedona. When I was developing that part of my project, I had tried to solve it using Spatial RDDs, as suggested by Amelia Holcomb initially, but sadly, the documentation of some of the features in Sedona are still in developing stages so I put that away. Because I had created an improved version of the trees layers, I had to repeat the estimation, but I couldn’t wait 11 more days, even though I had that code running, so I decided to go back to the Spatial RDDs. However, I had one big problem, the tree segmentation, which already takes a couple of hours, outputs a geopackage, and Apache Sedona, or at least the RDD API, is not functional with this type of vector data, so I had to transform that to a geoparquet. To do so, I found an optimal way to group tree tiles using the UK National Grid system, which divides the country into equally-sized squares of 1, 5, 10, 25, 50, 100 km. I used the 50 km size to group the tree tiles, and then optimised my existing code to add RDD capabilities, that I hadn’t been able to do a couple of months ago. One difference now, is that instead of using the tree polygon I am using the centroid and treating the tree as a point, as that simplifies Within spatial joins. This change took me a while to implement but I could finish the calculation in 12 hours instead of 11 days. I’m pretty sure it is possible to optimise even more but it’s good enough for now.
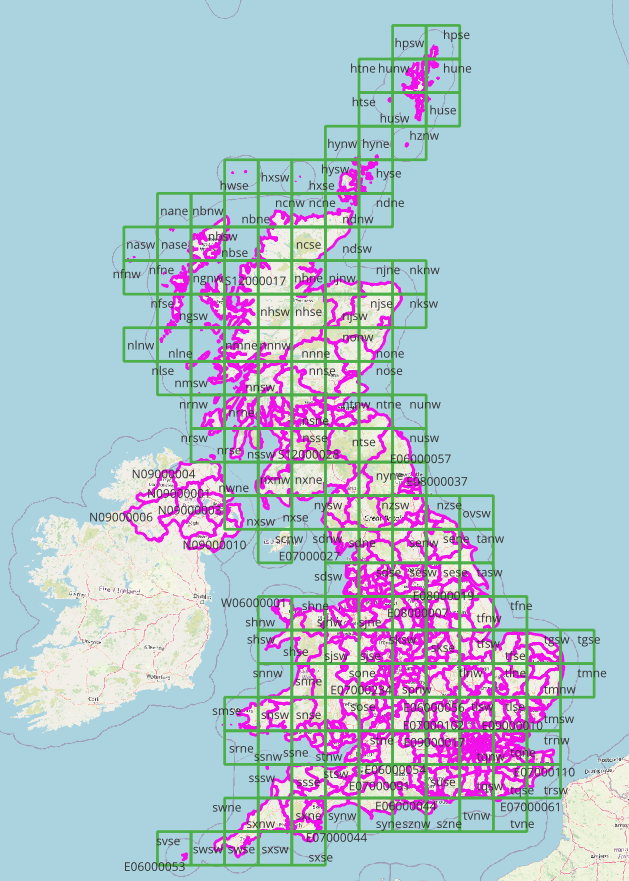
In addition to this, I also modified the calculation of spectral indexes from Sentinel-2 images to get the max value of NDVI per month and extract the median for a year and then compare between 2024 and 2016 as a measure of change in water, vegetation and built-up surfaces. By implementing all these changes and also because Ronita asked me to produce some figures, I accidentally found a way to scrape a Web Map Service and get tiles at the native highest resolution. I did a mini example trying to scrape the aerial images from Digimap and compare them to what I had used in my Masters project and it works. The only caveat is that they come with a label at the bottom of the image and they are not georeferenced, but this is not necessary for deep learning processing, also because how I’ve scraped them is using the national grid, so I know the coordinates I am requesting and can georeference after processing. Check the mini map I’ve included in the notes displaying how the statistical geographies (local authorities) overlap with the national grid, which is how most data is divided, such as the Vegetation Object Model or Aerial and LiDAR images.
Finally, in my side project working on building occupancy with the university, I’ve had to use ArcGIS Indoors to map floor plans from a couple of buildings in the city and they are a completely different domain from spatial data. I’ve had to learn to work with CAD software that I hadn’t used before to know what’s in the floor plans and how they rooms and spaces relate to each other and other floor plans. It’s a very interesting subject but it feels very different from traditional GIS work, even though they both fall under the spatial domain. I definitely didn’t find any useful tool in Python or any other programming language, so using a GUI is the way to go now. Unfortunately, all the good software for CAD manipulation are proprietary so that’s a niche where the OSS community is yet to fill in.
I applied to the turing enrichment scheme hoping I get a place there starting from the next academic year and I also applied for the Earth System Lab program for the coming summer.
On a side note, this last weekend was the best weather in months in Cambridge and I feel it deserves a shouout in the notes. I also got a new bike to replace my old mountain bike, that I’ve had for two years (for those reading in the future: you don’t need a mountain bike in Cambridge, look at a map 😉!!).