Transit Cost Project
17 January 2021
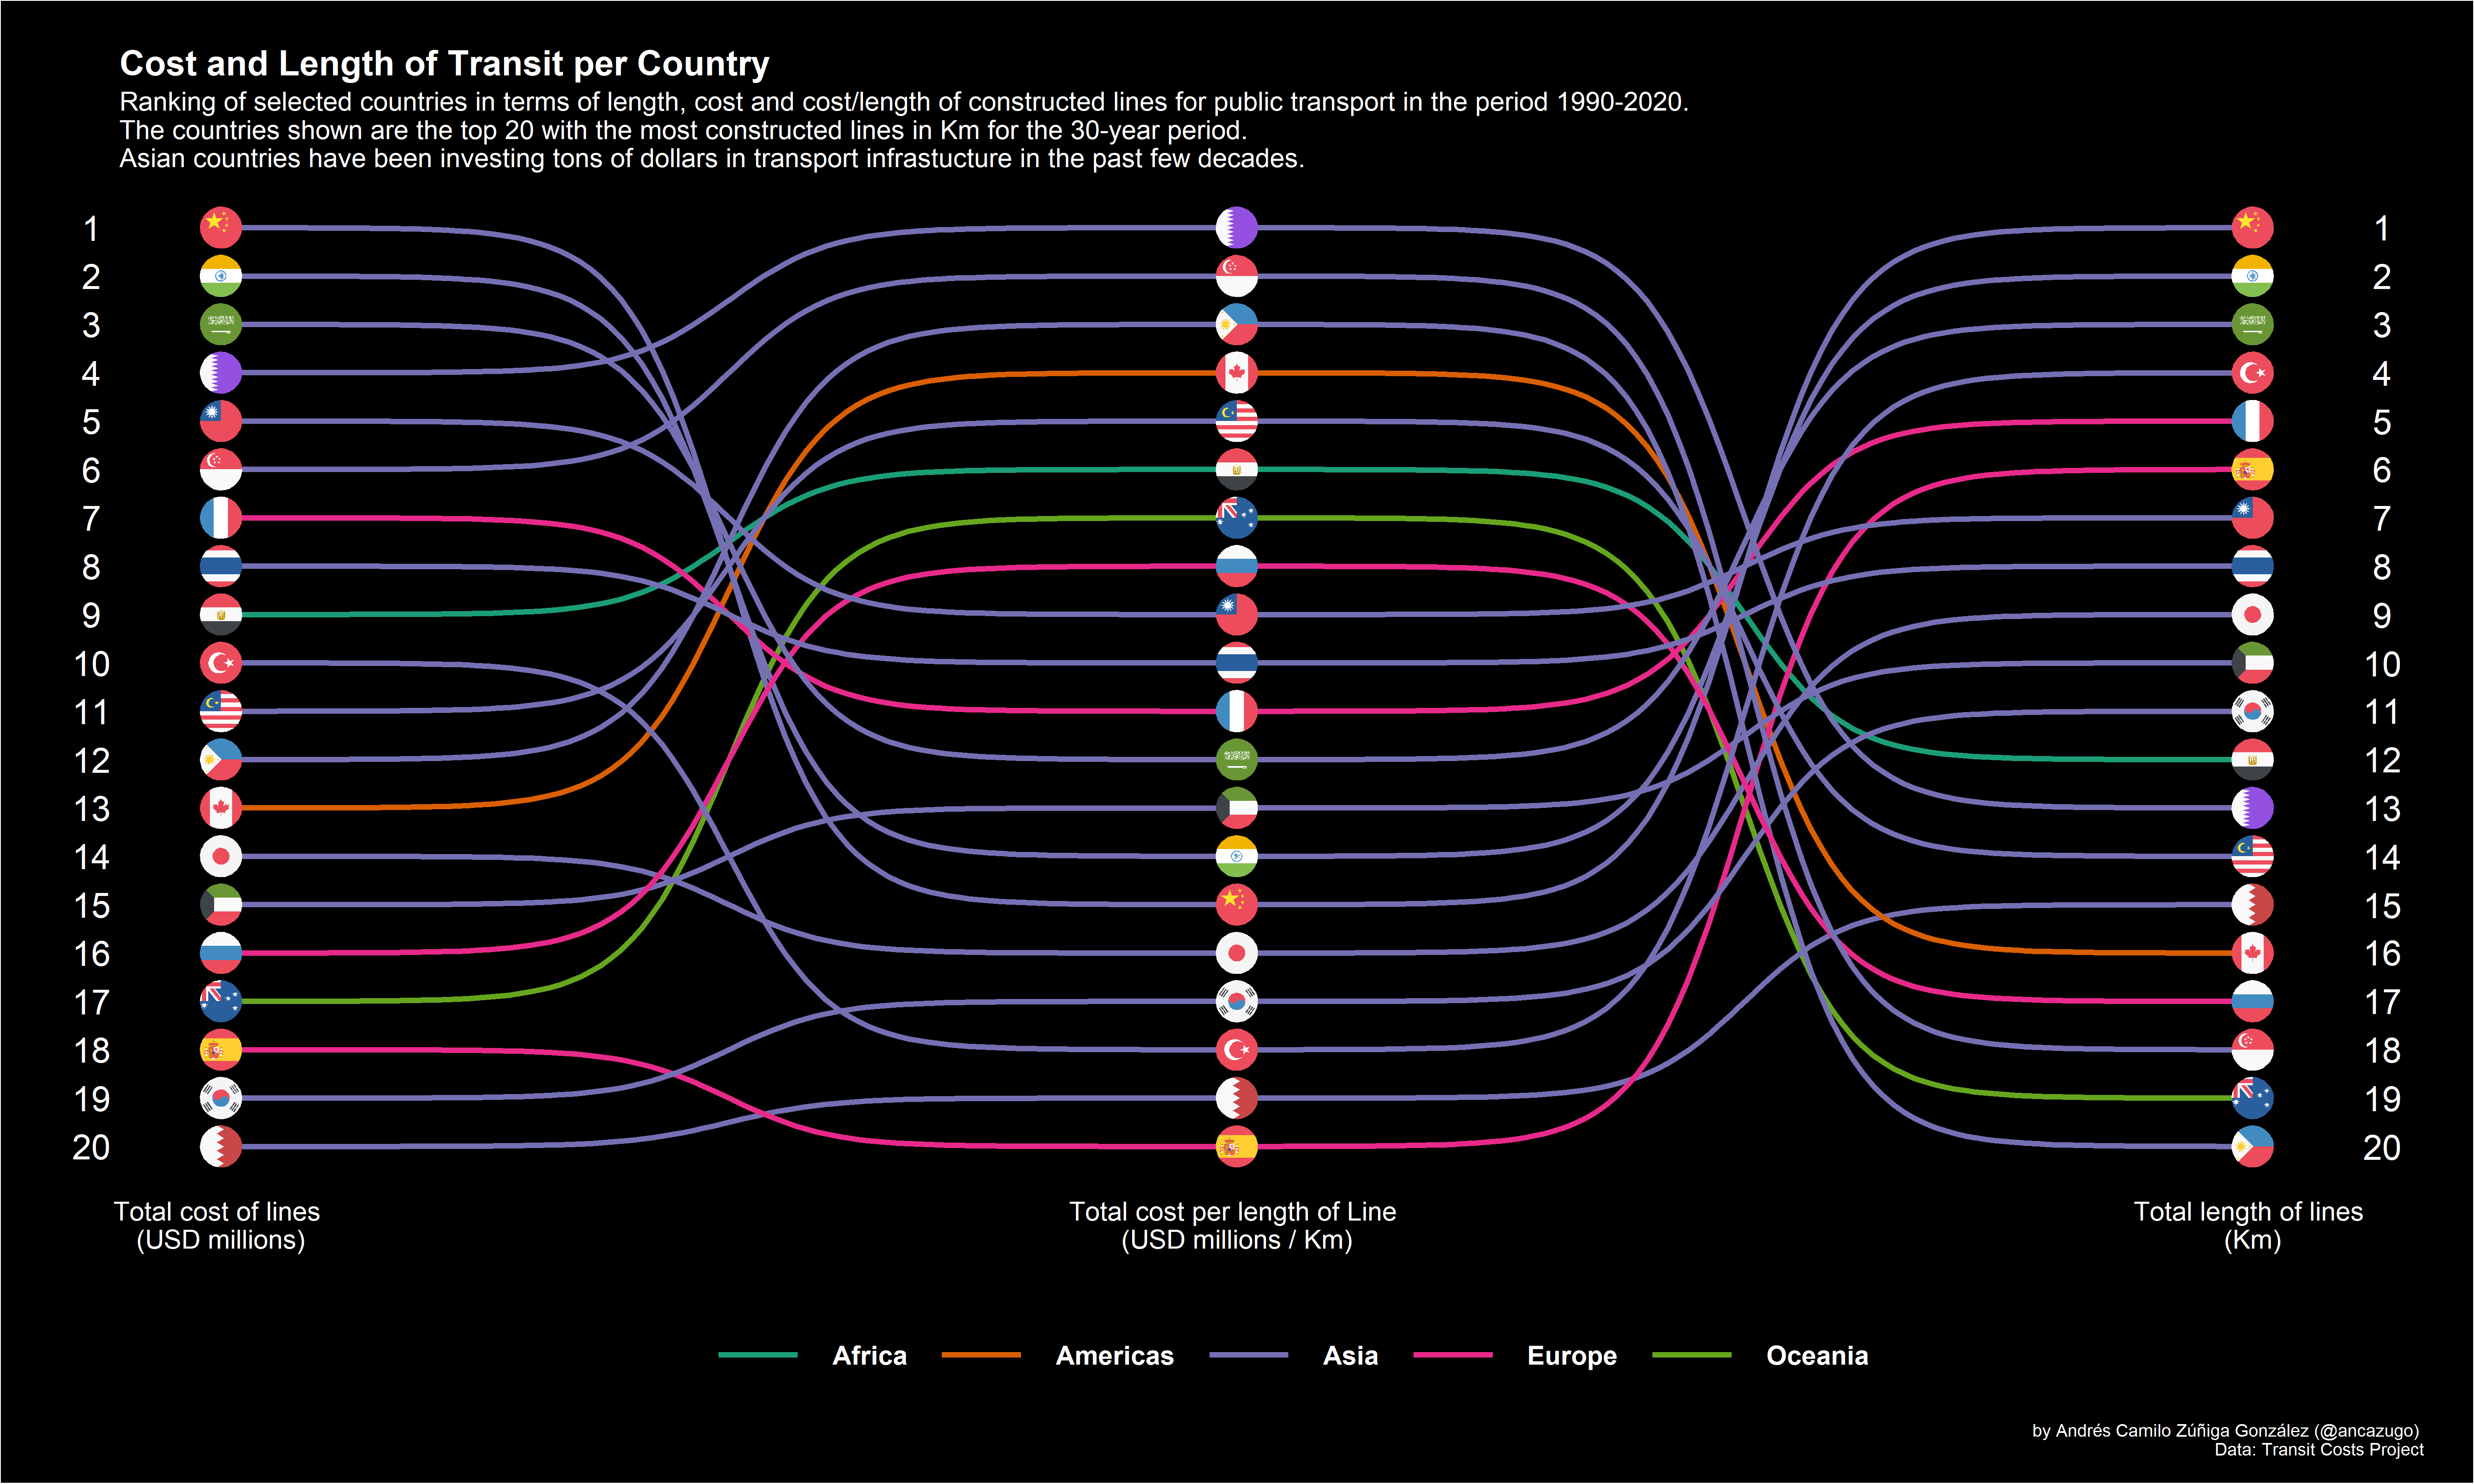
I have seen on Twitter the abundance of amazing visualizations made with R for the last copuple of weeks, so I wanted to give it try in the TidyTuesday contest and this is my first attempt. I wanted to create a ranking of the countries that spend the most and build the most in public transport. For this purpose, I made use of the ggbump and ggflags libraries that allow for a seamless visualization. Check the code in my GitHub repo.
