Kenya Census
Using maps and small multiples for census analysis
r
tidytuesday
dataviz
map

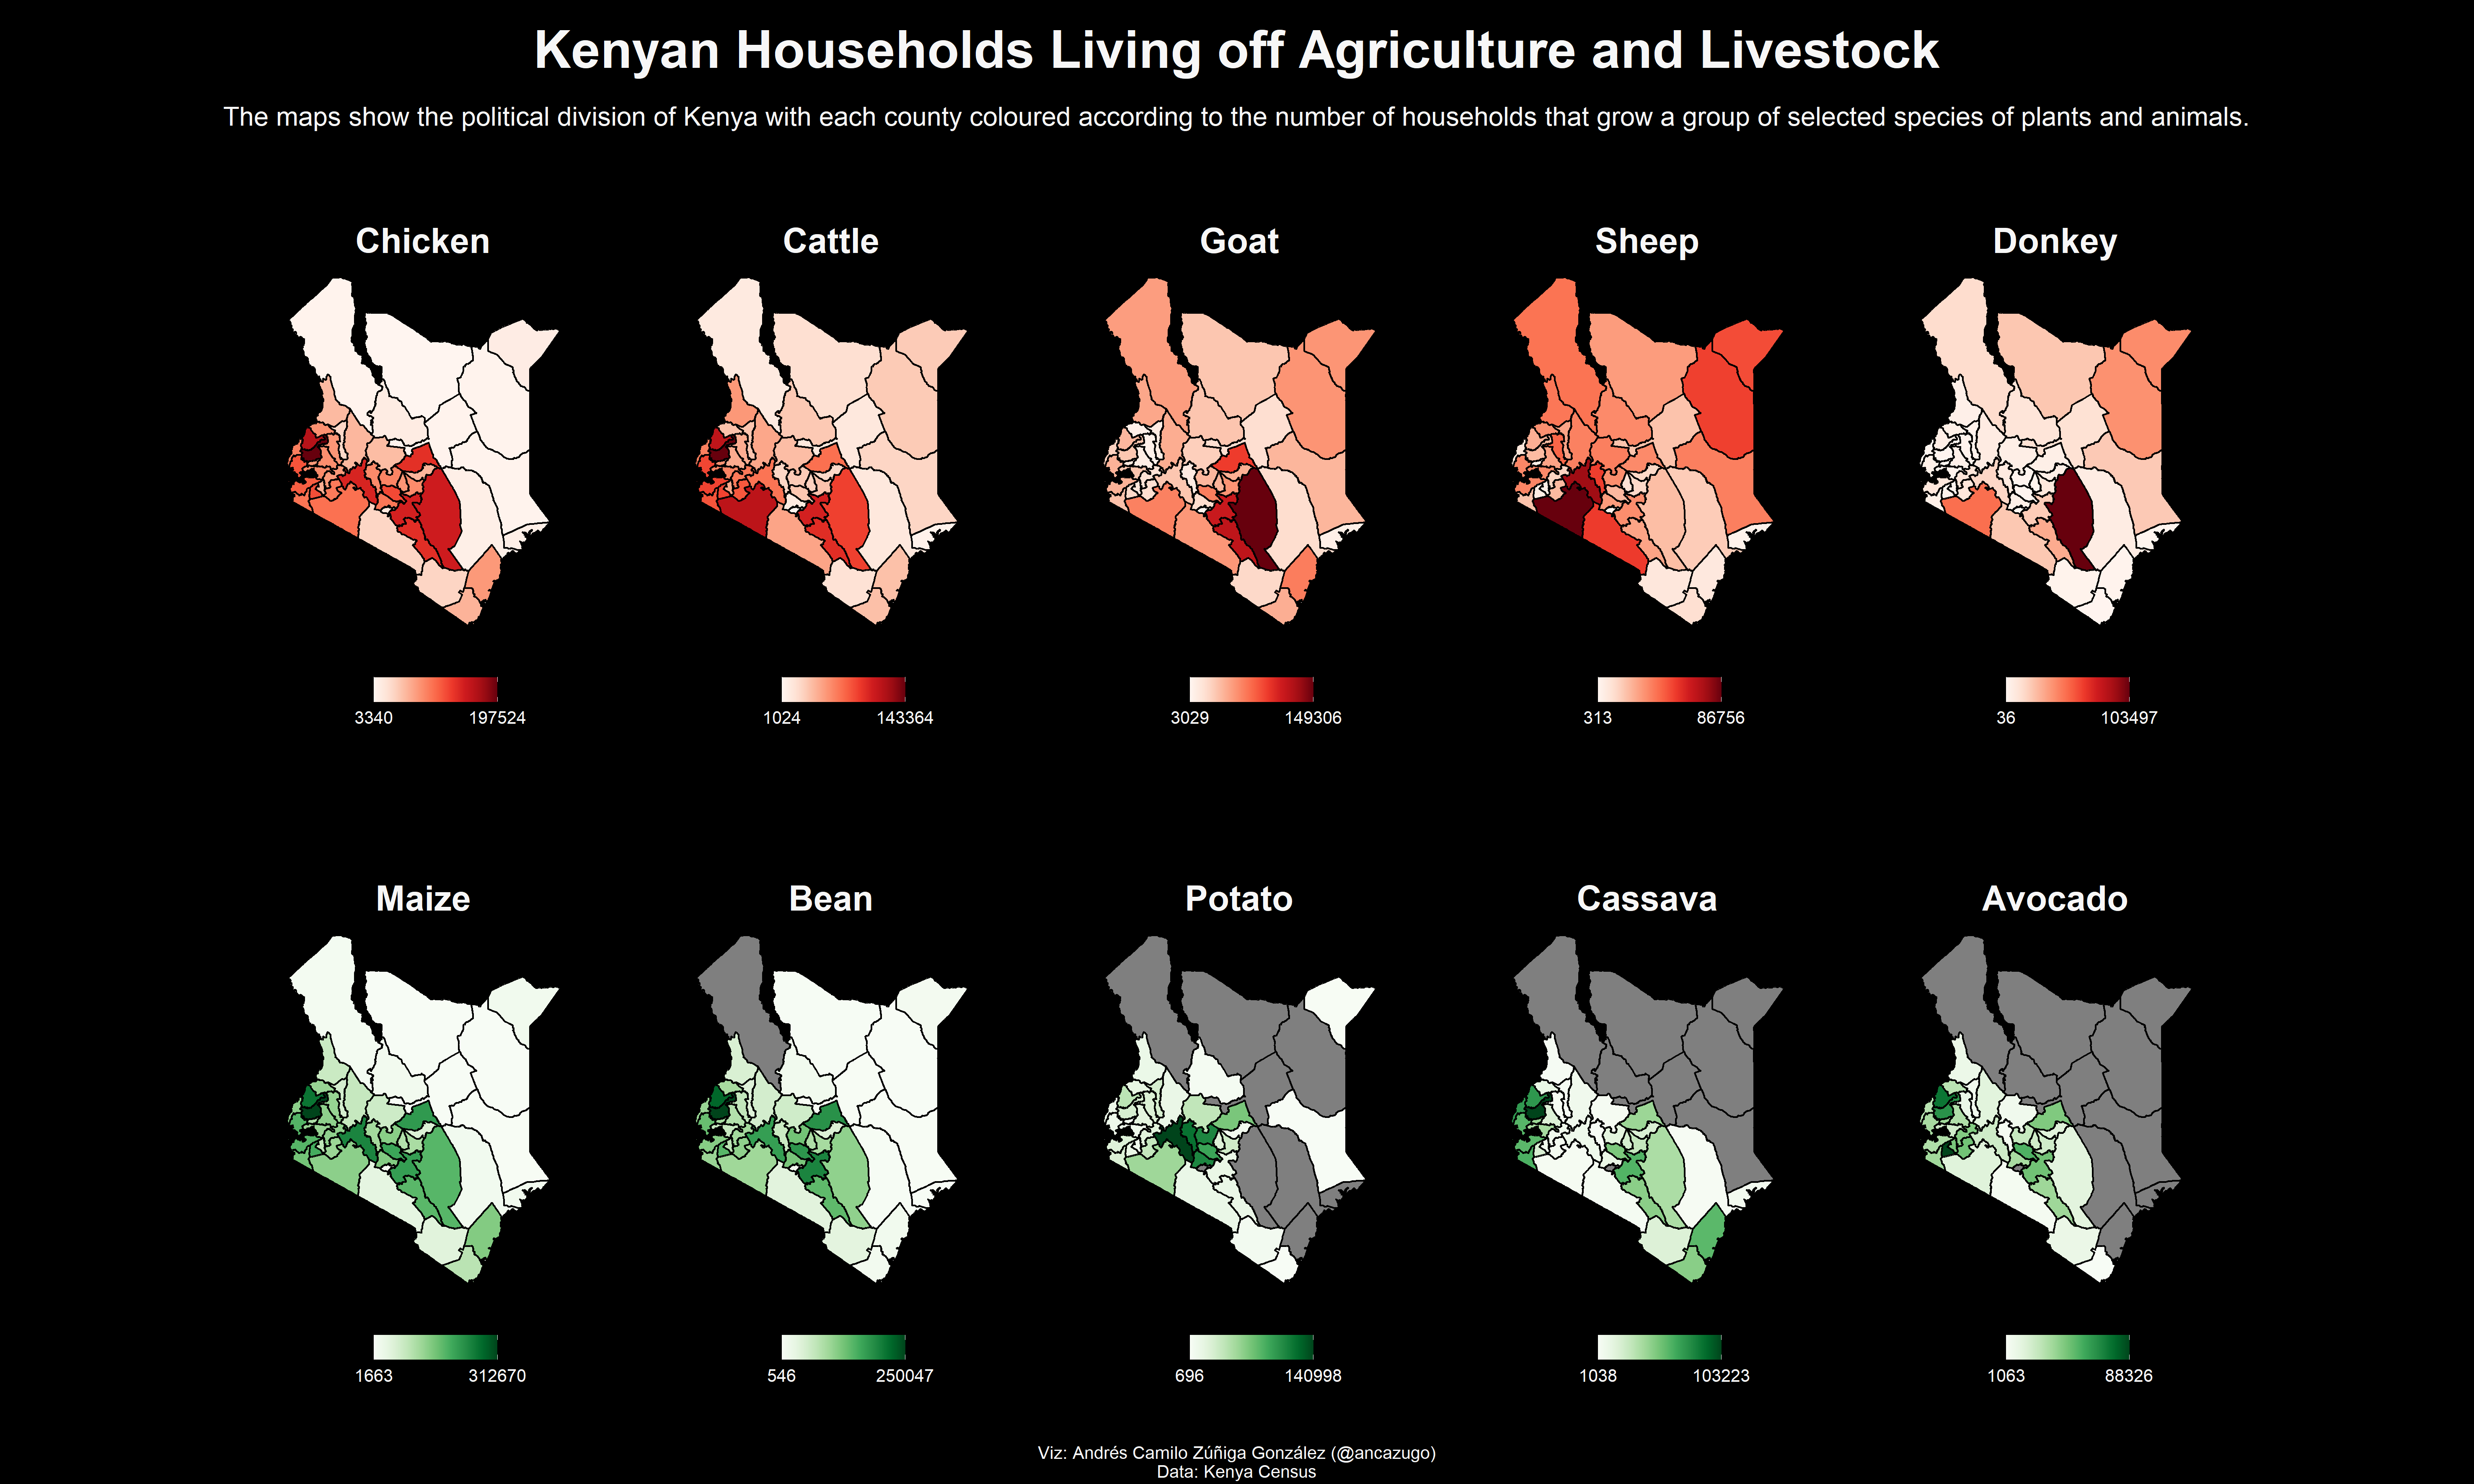
As a big fan of maps, I really wanted to make a great viz in this third entry of TidyTuesday so I used small multiples to represent household reliance on several types of plants animals as sources of food in Kenya. This is also the first time I use the patchwork package, which is amazing for combining multiple plots. Check the code in my GitHub repo.
Visualization
Reuse
Citation
BibTeX citation:
@misc{c._zúñiga-gonzález2021,
  author = {C. Zúñiga-González, Andrés},
  title = {Kenya {Census}},
  date = {2021-01-31},
  url = {https://ancazugo.github.io/posts/2021-01-31-kenya-census.html},
  langid = {en}
}
For attribution, please cite this work as:
C. Zúñiga-González, Andrés. 2021. “Kenya Census.”
Andrés C. Zúñiga-González, accepted, January 31. https://ancazugo.github.io/posts/2021-01-31-kenya-census.html.