Colombian Biodiversity Dashboard
06 December 2019
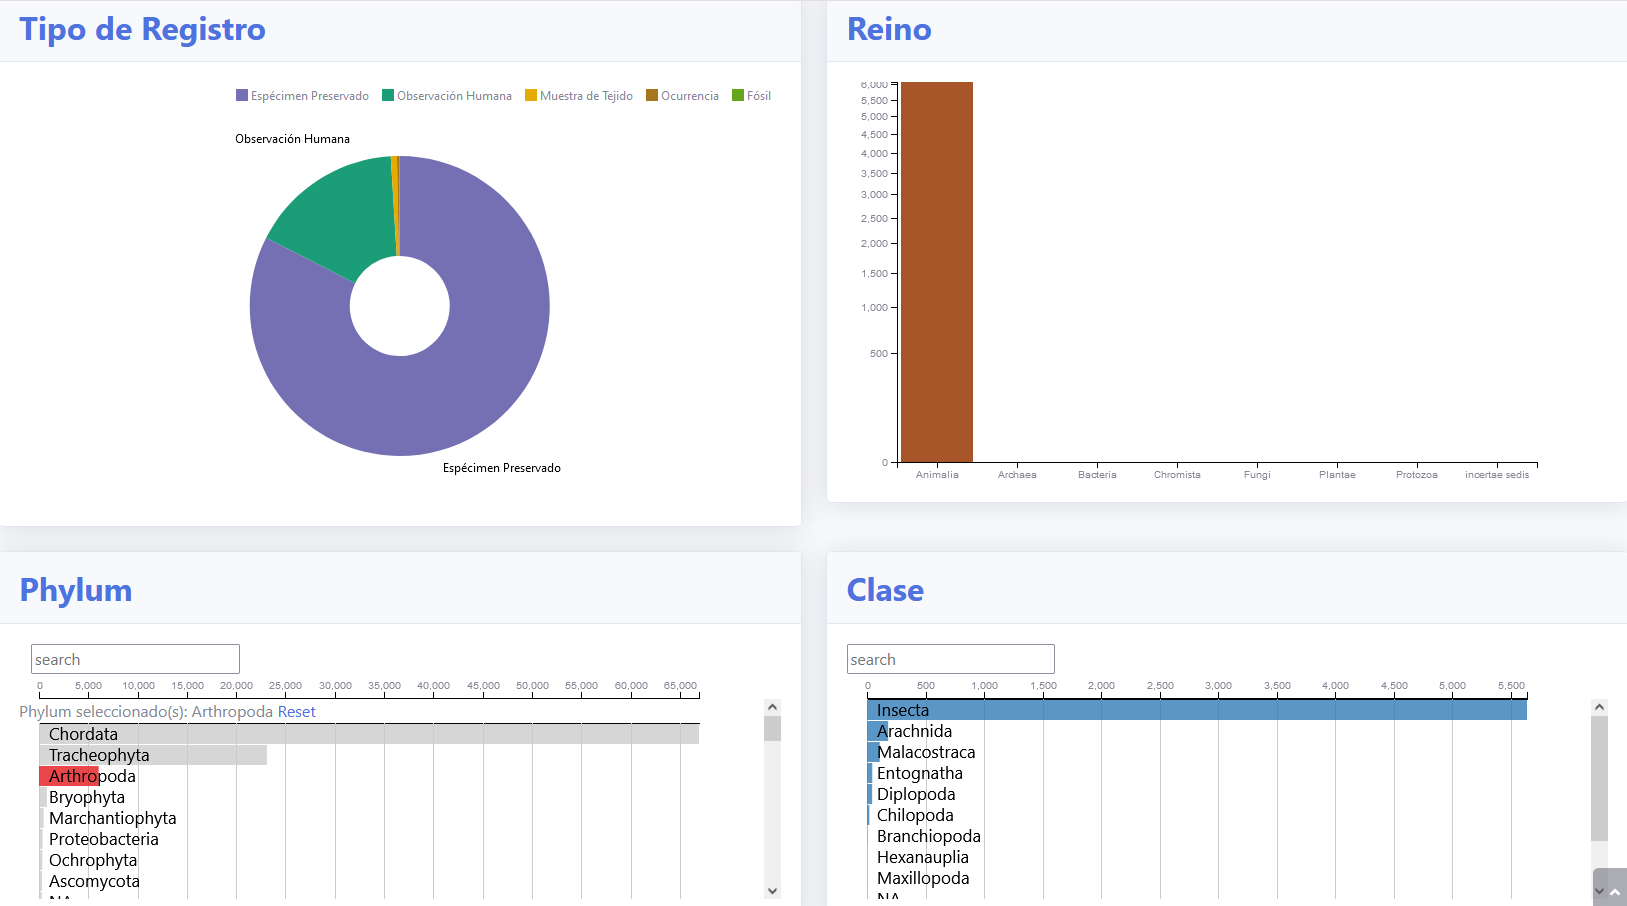
As the final project of the Visual Analytics Course at Uniandes, Alongside my classmates, we developed an interactive dashboard where it is possible to see the count of several animal and plant species recorded by Instituto Humboldt of Colombia, which is in charge of collecting this type of data. For this particular project, I created the Task 1 part with D3.js, where you can see and filter in real time every taxonomic division available and how many specimens have been found and by which institution. You can see the demo deployed here.